Pivot, Resistance & Support Level Analysis
Lets understand about Pivot, Resistance & Support (The three Pillers of Chart Analysis).
Lets understand about Pivot, Resistance & Support (The three Pillers of Chart Analysis).

This Pivot, Resistance, Support, Yesterday High & Yesterday Low.....all levels help you to understand the Trend of the Stock.
There are some rules to understand that....
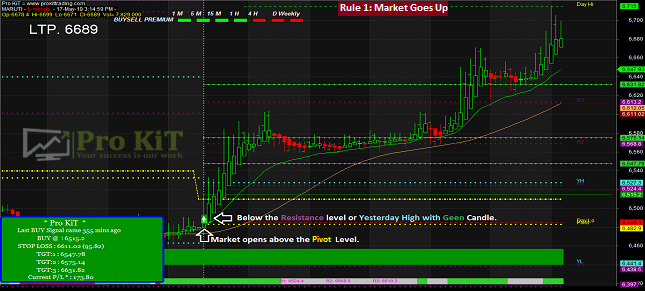
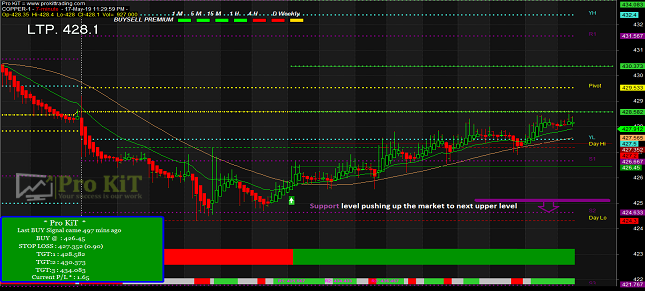
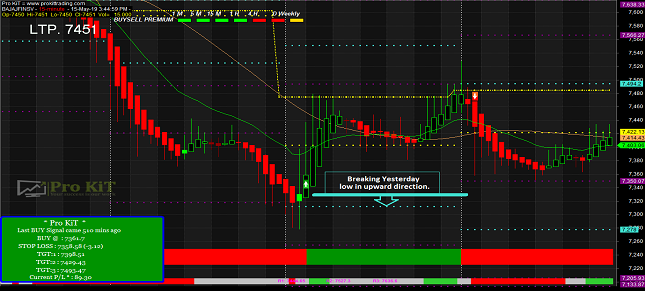
If the market opens above the Pivot Level & below the Resistance Level or Yesterday High with Green Candle. Its target is next upper level that is Yesterday High or Resistance Level.
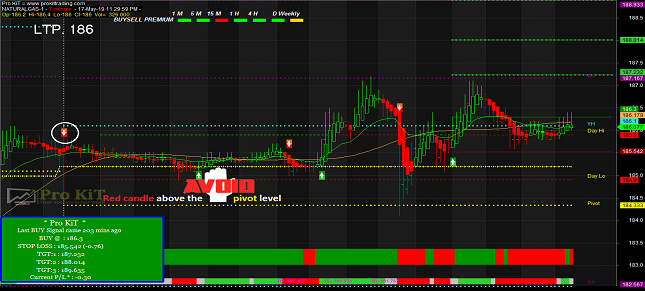
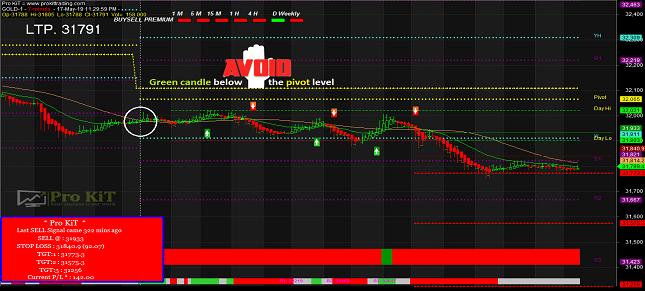
If the market opens below the Pivot Level & above the Support Level or Yesterday Low with Red Candle. Its target is next lower level that is Yesterday Low or Support Level.


Our goal is to help our clients to achieve good returns from the market by providing profitable trading signals and at the same time protect their trading capital.
We give the best service to our clients and enable them to make a good profit from share market, commodity market. Our vision is to update every movement of the market.

To begin trading the markets, make investment goals with your timeline and risk tolerance in mind. Research different companies’ current financial standing and history by looking at their balance sheets and income statements. Then research bonds and different types of funds, such as mutual or exchange traded. Choose a platform and purchase securities.
Automatically shows Green arrow when buy signal and Red arrow when sell signal. Plus it shows target and trailing stoploss lines. The software is developed on the world’s famous platform, if you have an account on MT4 or Amibroker then you can easily install our software without paying any additional charges

You can make payment through your credit/debit card (National & International) and Net Banking Facility